
Accelerate Machine Learning and Cut Prep Time on Your Data Science Workbench Platform
Manual data prep and extraction is expensive. So are data scientists.
Yet, they spend at least 60% of their time cleaning and organizing data.
Why? The answer is simple. Information is tough to access because of where it’s stored or how it’s labeled in their environment.
It’s logical to think that machine-created data is also machine-readable, but it’s not. For it to be machine-readable, there would have to be one standard data structure for all organizations to follow.
If you solved the accessibility problem, you would greatly cut the time to experiment, collaborate and deploy models faster.
The end result would be much better decision-making and problem solving.
For data scientists, there is a way to easily clean and normalize all data…
Here’s How You Can Go From Research to Production Faster
and Get Better Data Science Results:
Give Valuable Business Insight and Deploy Models Faster through Grooper’s Data Science Workbench Tools
Boost your data science tasks, such as:
Tools such as R, Python, or Scala transform the way you work with data, but have frustrating limits extracting large document sets. While not open source, Grooper’s open cockpit design provides transparency and fine-tune control over settings.
Grooper combines the power of open source tools with native data and document processing tasks to function as a highly efficient data science workbench.
What is a Data Science Workbench?
A data science workbench is a self-service application that enhances data scientists usage of their libraries, technologies and analytics pipelines in a local environment to boost machine learning projects from discovery to production. With a data science workbench, data scientists can use existing skills, languages, and tools (like R and Python) already stored on their machines to run computations. They can also be used to train, deploy and manage data models for improved compliance and agility.
Data Science Workbench Testimonials
Featured Case Studies
Thousands of companies choose BIS to enrich their environment with unique data science solutions. Here are some of their stories.
Case Study: Data Extraction in Medical Documents
See how a leader in the medical / healthcare equipment industry is improving their patient’s lives days or weeks faster through improved data extraction.
Financial Document Automation Case Study
In this financial document automation case study, get in-depth info on how automation improves member services and creates happier employees.

Banking Automation Case Study
Uncover how financial industry leaders use modern banking automation and other technologies to save big time and money. Get the case study here!
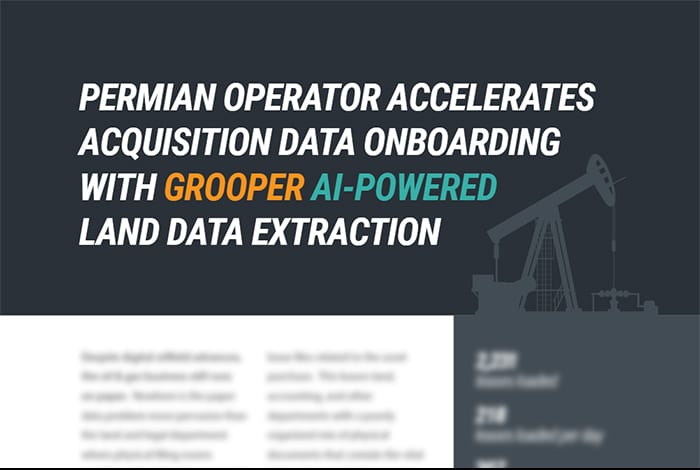
Oil and Gas Industry Case Study: Advanced Lease Analytics
Tired of all the time & costs with manually processing documents? In this oil and gas big data case study, uncover how others are outpacing the competition.